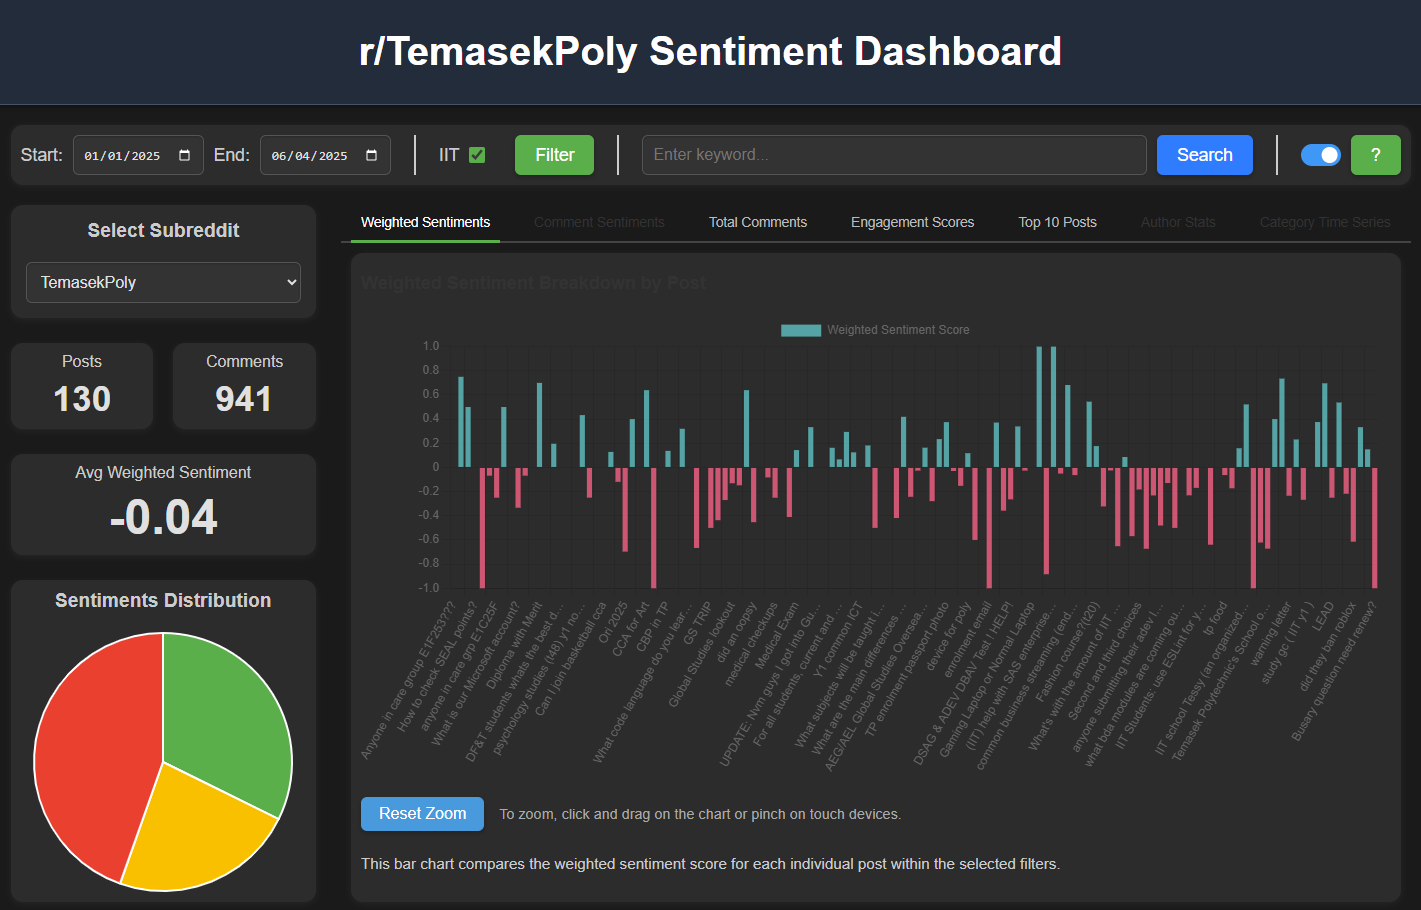
TPCraw is a Python-based project that crawls posts and comments from Singapore's polytechnic subreddits and then analyzes them using Google’s Generative AI (Gemini). The project produces sentiment analyses, summaries, and visualizations (via a web-based dashboard) to gain insights into discussions about the polytechnics on Reddit, with a particular focus on Temasek Polytechnic.
This application is a tool designed to gather, process, and visualize user-generated content from
Reddit's Singapore polytechnic communities — r/TemasekPoly, r/nanyangpoly,
r/republicpolytechnic, r/SingaporePoly, r/NgeeAnnPoly,
r/nyp and r/sgExams. It consists of two major components:
The app runs automatically every day at 5 AM Singapore Time, ensuring consistent and up-to-date data collection. It provides a robust framework for monitoring sentiment trends, analyzing user feedback, and identifying popular topics or concerns related to Temasek Polytechnic.
The Frontend Dashboard is a dynamic and user-friendly web interface built with HTML, CSS, and JavaScript. It serves as the primary visualization tool for the data collected by the Python crawler. Users can interact with various charts, tables, and filtering options to explore sentiment analysis results from whichever polytechnic subreddit they select.
This dashboard allows users to:
The dashboard is implemented using Chart.js for visualization, Firebase Firestore for data retrieval, and Chart.js Zoom Plugin for interactive zooming and panning capabilities. It provides a comprehensive view of the sentiment trends and engagement metrics, making it easier to uncover valuable insights from the collected Reddit data.
The Select Subreddit dropdown, at the top of the left-hand column, controls which community the entire dashboard reports on. Changing it reloads every chart, table and metric on the page against that subreddit's data — no page refresh required.
| Option | Subreddit |
|---|---|
| Temasek Poly | r/TemasekPoly (default) |
| Nanyang Poly | r/nanyangpoly |
| Republic Poly | r/republicpolytechnic |
| Singapore Poly | r/SingaporePoly |
| Ngee Ann Poly | r/NgeeAnnPoly |
| Nanyang Poly Students | r/nyp |
| SGExams | r/sgExams |
Some filters are specific to a community, so the dashboard shows and hides them as you switch.
The IIT checkbox applies only to r/TemasekPoly, and the
TP-Related? checkbox applies only to r/sgExams, where posts cover
every institution and most are unrelated to Temasek Polytechnic.
The Keyword Search box searches the text of posts and comments in the selected subreddit and date range, rather than filtering the charts. Results open in the details panel, split into matching posts and matching comments, with the search term highlighted in each excerpt.

The Date Range & IIT Filter feature provides users with flexible data filtering options, enabling customized analysis.
| Component | Function |
|---|---|
| Start Date | Choose the beginning of the analysis period. |
| End Date | Select the end date (defaults to today). |
| IIT Checkbox | A checkbox option allows users to filter posts specifically related to the School of Informatics & IT (IIT). When enabled, only posts marked with a relevance flag (iit: "yes") are displayed. This is particularly useful for examining feedback or discussions directly related to IIT courses or facilities. Results may not be very accurate as we are using Gen AI to categorize whether or not a post is associated with IIT. |
| TP-Related? Checkbox | Shown only when r/sgExams is selected. That subreddit covers every institution in Singapore, so this filter narrows results to posts the crawler flagged as mentioning Temasek Polytechnic (relatedToTemasekPoly: true). As with the IIT flag, the classification comes from Gen AI and may occasionally misfire. |
| Filter Button | Once the desired filter criteria are set, clicking the "Filter" button updates all charts and visualizations in real-time, ensuring that only relevant data is displayed. |
This feature enhances the user’s ability to tailor their analysis to specific periods or areas of interest, making the dashboard versatile and adaptable.
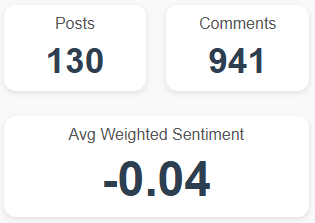
The Posts, Comments, and Avg Weighted Sentiment Metrics feature provides a quick summary of key data points, displayed prominently at the top of the dashboard.
| Component | Function |
|---|---|
| Posts | Displays the total number of posts retrieved from the Reddit subreddit r/TemasekPoly based on the selected date range and filters. This helps in quickly assessing the volume of discussions and interactions within a specified timeframe. |
| Comments | Shows the aggregate number of comments associated with the retrieved posts. This metric indicates the level of engagement and interest generated by the posts. |
| Avg Weighted Sentiment | Calculates the average sentiment score of all fetched posts. This score is weighted based on engagement metrics such as upvotes and comments, providing a balanced measure of user sentiment. |
These metrics offer a high-level overview of user engagement and sentiment trends, serving as a starting point for deeper analysis through the various charts and graphs available on the dashboard.
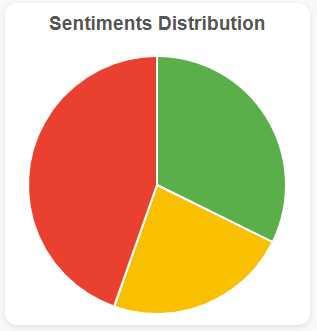
The Sentiment Distribution Pie Chart provides a high-level overview of the sentiment breakdown across all posts within the selected date range. This chart categorizes sentiment into three primary groups:
The pie chart helps users quickly gauge the overall sentiment landscape by showing the proportion of each sentiment type. It is especially useful for identifying whether the general mood is positive, negative, or balanced. Users can apply filters to narrow down the data by date range or IIT-related content.
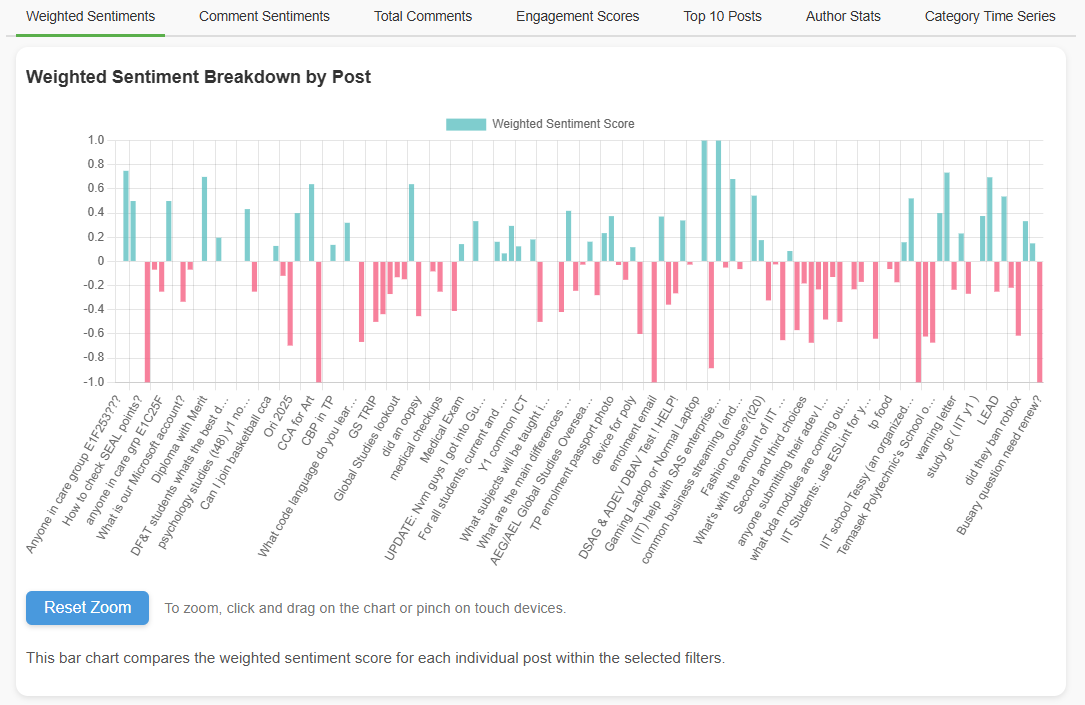
The Weighted Sentiment Breakdown Chart displays the Weighted Sentiment Scores for individual posts based on the selected filters. Each bar in the chart represents a post, with the score indicating how positive or negative the overall sentiment is.
The weighted sentiment score is calculated by combining the sentiment polarity of each post with engagement metrics such as comments and upvotes, providing a more accurate reflection of popular opinion.
Users can click on a specific bar to view detailed post information, including its title, summary, and related comments. Additionally, the chart supports zooming and panning, enabling users to explore data at various levels of detail.
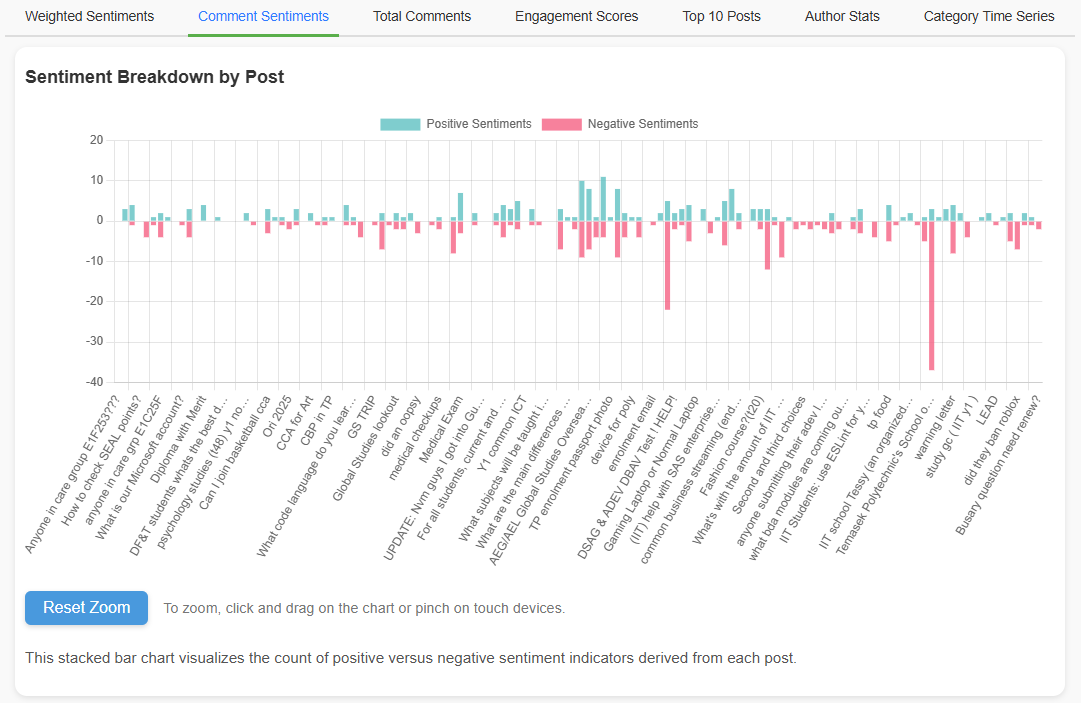
The Comment Sentiment Stacked Chart provides a comprehensive view of user feedback by displaying positive and negative sentiments for comments on each post.
This stacked chart helps identify the overall sentiment distribution across all comments for each post. The height of each bar indicates the total number of sentiments, making it easy to compare engagement levels and emotional responses.
The chart supports interactive zooming and panning, allowing users to closely examine specific posts or date ranges. Additionally, users can click on a bar to view the underlying comments and their detailed analysis.
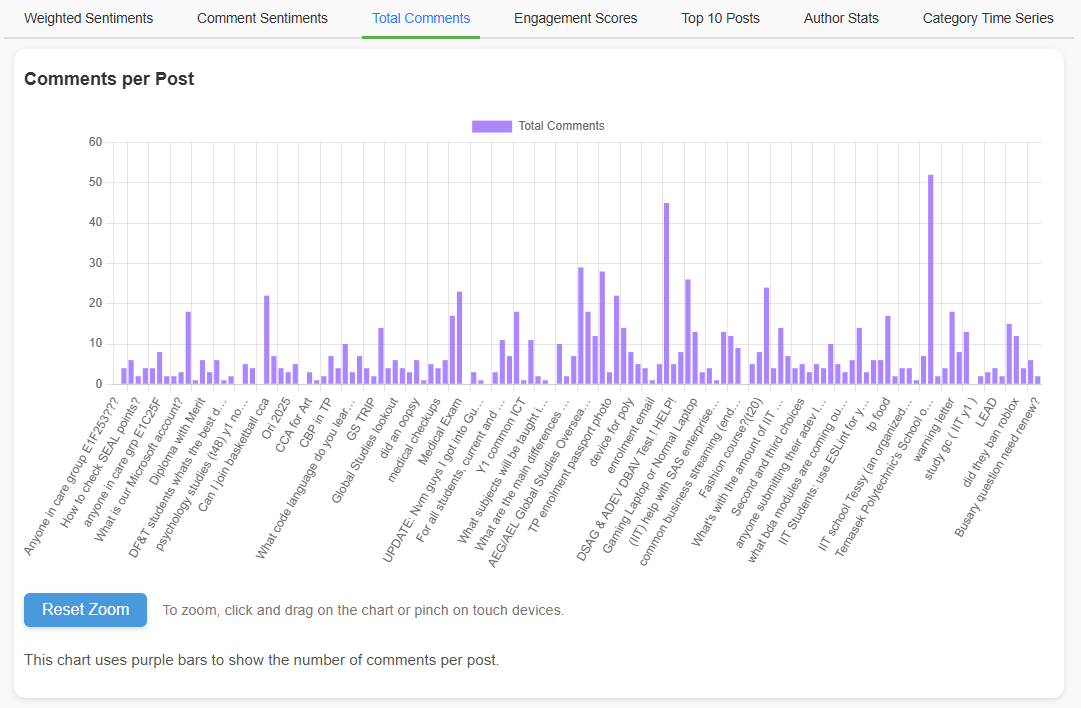
The Total Comments Chart presents the total number of comments each post has received, visualized as a bar chart.
This chart is particularly useful for identifying which posts have sparked the most conversation. By clicking on a specific bar, users can view detailed insights about the post, including its content, sentiment analysis, and associated comments. The chart supports zooming, panning, and filtering, enhancing the exploration of high-engagement posts over time.
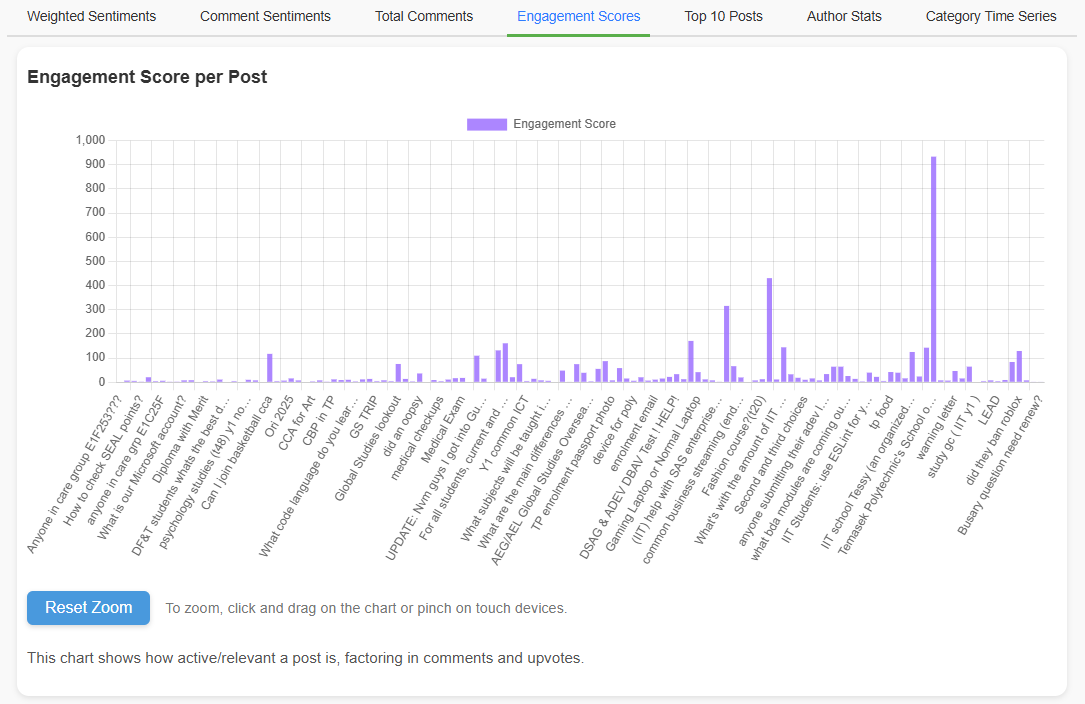
The Engagement Score Chart visualizes the overall popularity and interaction level of each post. The Engagement Score is calculated by combining the number of upvotes and comments, factoring in their influence through a logarithmic scaling approach.
This bar chart allows users to quickly identify which posts have attracted the most attention and engagement from the community. Each bar represents a post, with taller bars indicating higher engagement. The chart supports interactive zooming and panning, allowing users to closely examine posts from different time periods. Additionally, clicking on a bar displays detailed information about the post.
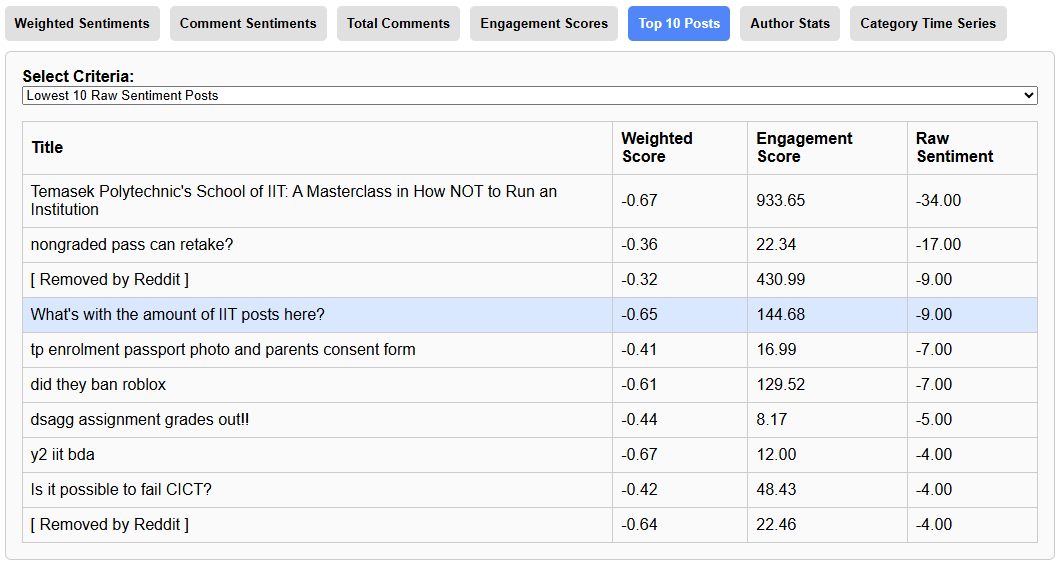
The Top 10 Posts feature provides a dropdown-driven table view that allows users to filter and view the most relevant posts based on various criteria. This feature serves as a streamlined way to quickly access key insights from the dataset without manually browsing through all available posts.
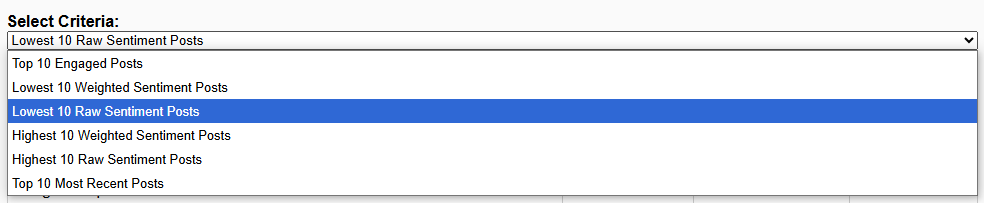
The Top 10 Posts feature ensures that the most important or relevant posts are always accessible with a few clicks, making it a valuable tool for ongoing monitoring and analysis.
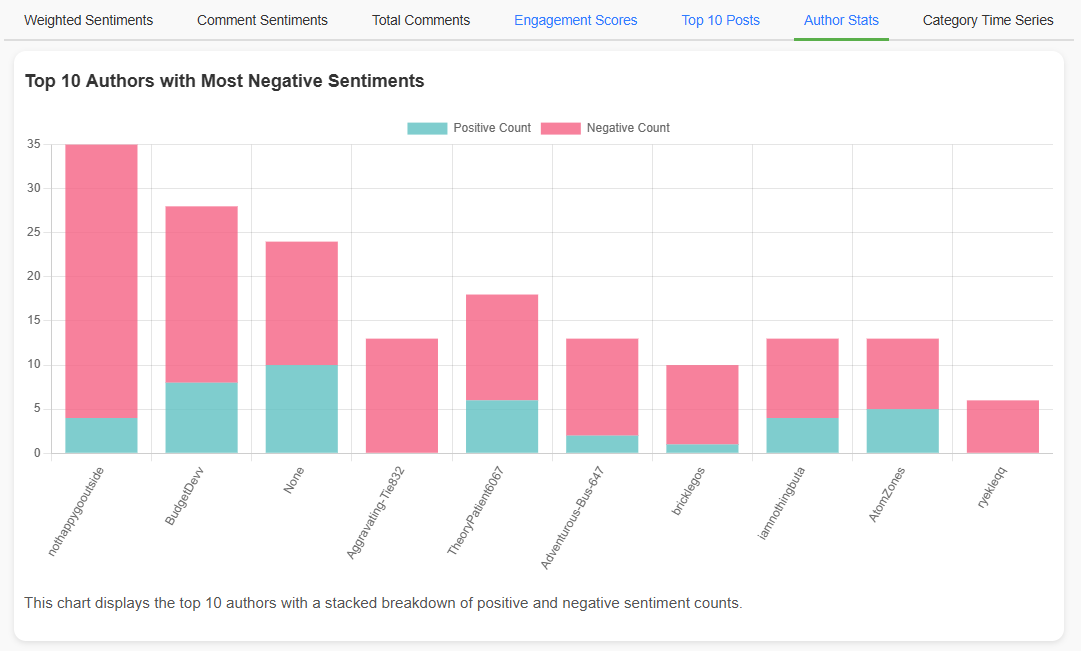
The Top 10 Authors Chart displays a stacked bar chart highlighting the authors with the most negative sentiments in their posts and comments.
This feature is useful for identifying potential issues, complaints, or grievances that might need attention. It also allows for tracking individual authors over time to understand their overall sentiment trend. Clicking on any bar reveals all related posts and comments made by the selected author.
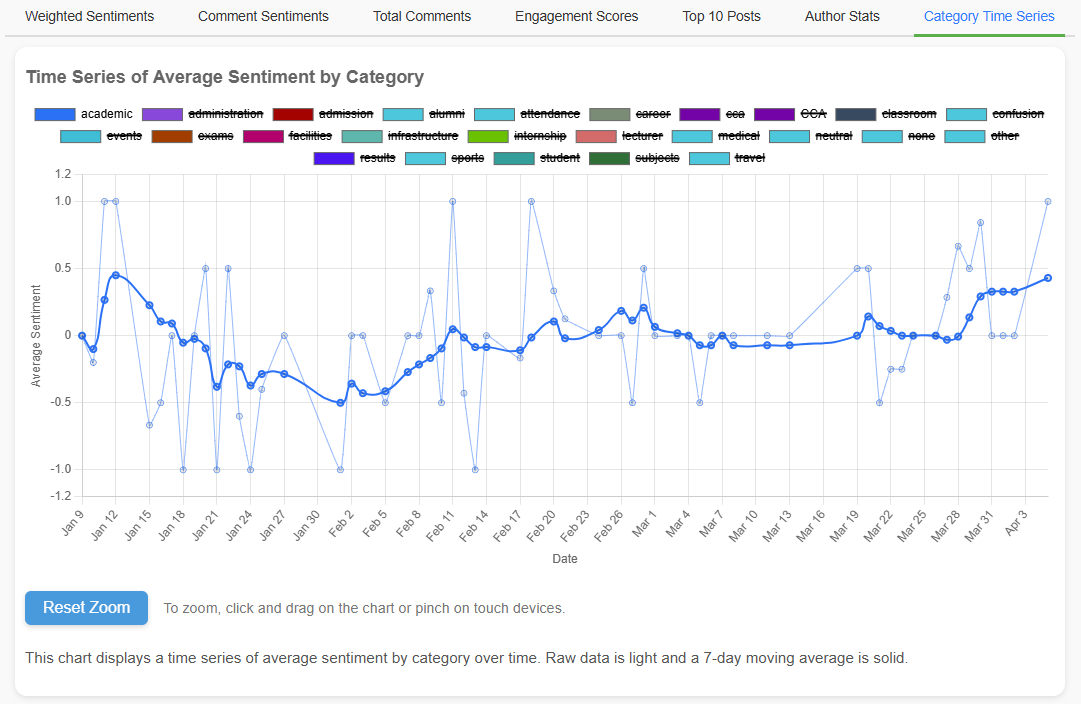
The Category Time Series Chart provides a powerful way to visualize sentiment trends over time for various categories.
This feature enables users to track how sentiment evolves across different categories over time, making it easier to spot emerging issues or improvements.
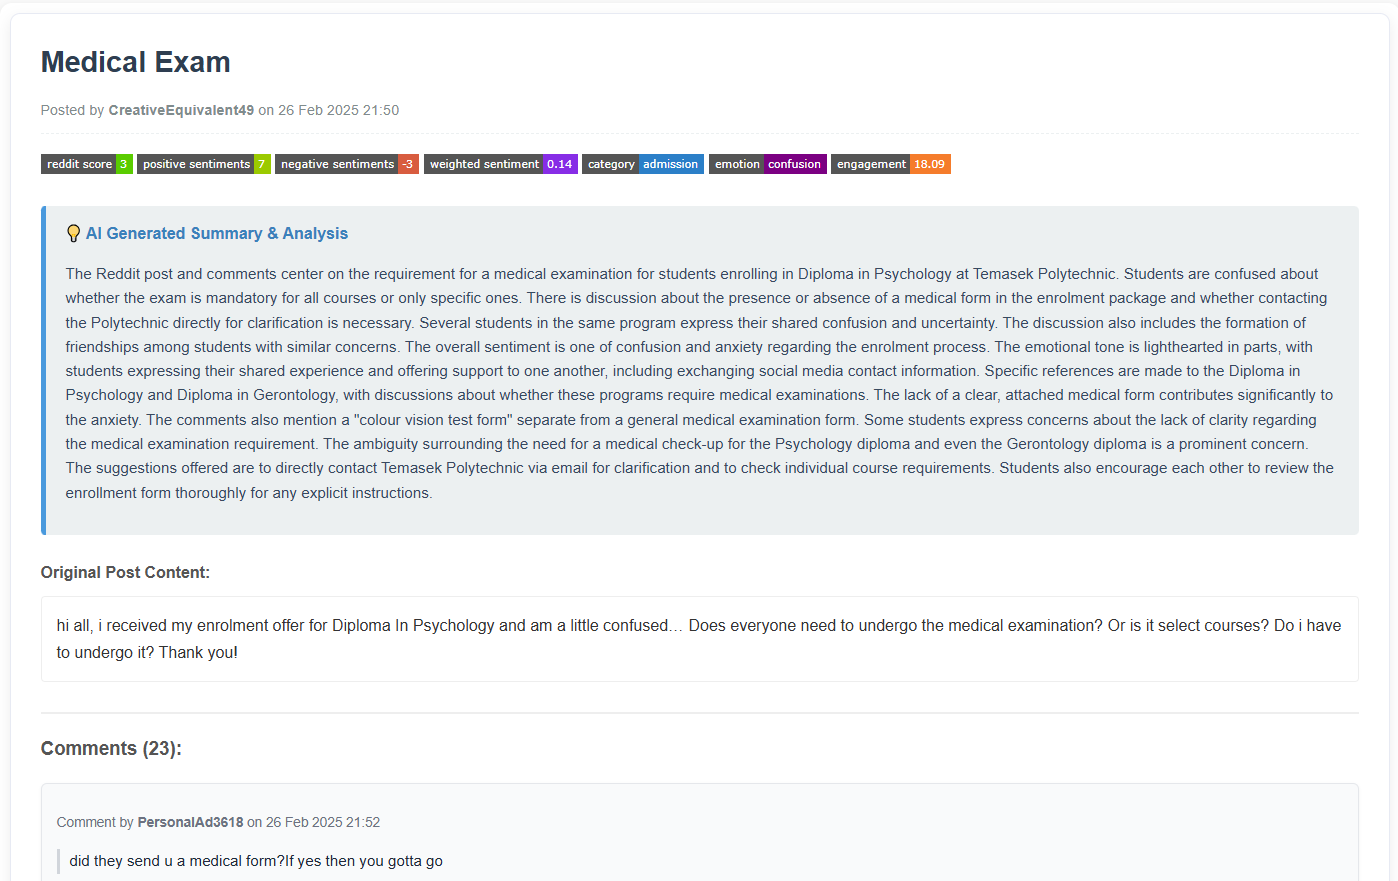
The Post Details Display feature provides an in-depth view of a specific Reddit post and its associated comments when you click on any bar in the various charts.
How It Works:
Information Displayed:
Export to PDF:
TPCraw_Analysis_Report.pdf.The Post Details Display feature provides a comprehensive breakdown of each post, making it easy to dive into individual conversations and analyze specific interactions.
The switch in the top-right corner of the dashboard toggles between the light and dark stylesheets. Your choice is saved in the browser's local storage, so the dashboard opens in the same theme on your next visit, and this About page follows the same setting.
The theme is applied before the page renders, so switching to dark does not produce a white flash on load. If your browser blocks local storage (private browsing, for example), the theme still works for the current session but will not be remembered.
The dashboard adapts to the screen it is opened on, from a desktop monitor down to a phone in portrait orientation.
| Screen | Behaviour |
|---|---|
| Desktop wider than 1024px |
The original two-column layout: summary metrics and the sentiment pie on the left, the tabbed charts on the right. |
| Tablet up to 1024px |
Collapses to a single column, with the summary cards rearranged into a grid above the charts. The tab bar becomes a horizontally swipeable strip instead of wrapping onto several rows. |
| Phone up to 768px |
Filter controls stack full width, charts are given a taller fixed height so the plot area stays readable, axis labels shorten and thin out, chart legends move below the plot, and the post details panel opens full screen. |
Touch gestures:
Rotating a phone between portrait and landscape re-renders the charts at the new size using data already loaded, so no additional queries are made.
The crawler component of the application continuously collects user-generated content from the
polytechnic subreddits on Reddit. The list of communities it visits is read from
subreddits.txt, so adding or removing one is a configuration change rather than a
code change. It fetches both posts and comments
using the PRAW (Python Reddit API Wrapper). This automated data gathering ensures that the application
stays up-to-date with the latest discussions, feedback, and trends related to the polytechnics.
The crawler retrieves a maximum of 500 recent posts and their associated comments each time it runs,
providing a comprehensive dataset for further analysis.
For the broader r/sgExams community, the crawler additionally detects whether each
post or comment actually mentions Temasek Polytechnic and records that as a
relatedToTemasekPoly flag, which is what the dashboard's
TP-Related? filter reads.
Leveraging the power of the Google Gemini API, the application processes each Reddit post and comment to extract insightful information such as:
The sentiment analysis enables the identification of themes, emotional trends, and areas of concern, providing valuable insights into how users feel about various aspects of Temasek Polytechnic.
All processed data is stored in Firebase Firestore using a well-defined and structured schema. This ensures efficient storage, quick retrieval, and organized management of posts, comments, and their related metadata. The data storage structure supports:
By employing Firebase Firestore, the app benefits from high availability, real-time updates, and secure data handling, essential for a robust and reliable sentiment analysis platform.
The application continuously aggregates and updates collected data to provide meaningful insights over time. It supports:
This feature ensures that the application provides accurate, up-to-date analysis while minimizing resource consumption through incremental data processing.
The application is built with robust error handling mechanisms to ensure smooth operation even when encountering issues. It includes:
crawler_errors.log file for easy troubleshooting and debugging.This resilience ensures that the application can handle unexpected issues without compromising data integrity or overall functionality.
The crawler is configured to run automatically every day at 5 AM Singapore Time using GitHub Actions. This automated scheduling provides:
By leveraging GitHub Actions for scheduling, the application maintains a seamless and uninterrupted data collection process.
The sentiment data shown is auto-generated using Google Gemini AI models. While generally accurate, edge cases may exist. Always cross-reference with the post and comment content for accurate interpretation.